Benchmarking Your Google Adwords and Product Listing Ad Metrics
If you are going to be pumping your hard earned cash back into advertising and promoting your business, you will certainly want to know whether that’s cash is doing its best for your bottom line. While Google AdWords and Google Shopping provide excellent reporting facilities that make you aware of every action taken by your customers, without anything to compare these metrics to you can quickly feel like you are lost at sea. Or, more specifically, lost in endless data.
But don’t fear. One of the beauties of Google’s advertising products is that they cater to both highly advanced users and total beginners at the same time, so with a little help and the use of a few industry benchmarks, you should be just fine. Here we take a look at three of the most important metrics to focus on if you are just starting out, and how you can use them to assess the effectiveness of your advertising spending.
Click through rate
Click through rate is a reasonably self-explanatory metric measured by taking into account the number of times your ad has been shown to users compared to the number of times your ad has been clicked.
On the AdWords advertising platform, Google advice is that beginner advertisers should be aiming to get their click through rate as close to 2% as possible, especially in competitive industries. However, in non-competitive industries (ones where there aren’t as many advertisers involved as there are in, say, the short term loan niche) then you can realistically aim for a click through rate of around five percent.
However, click through rates are highly dependent on your position within the sponsored listings. Much like the organic search results, being at the top of the sponsored results is likely to (but will not always) generate a higher number of clicks. A recent study of the average click through rates on AdWords looked at two million clicks over 12 months of activity in multiple industries, you can see the results below:
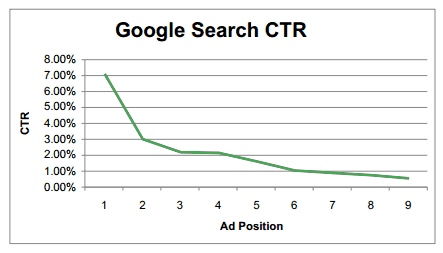
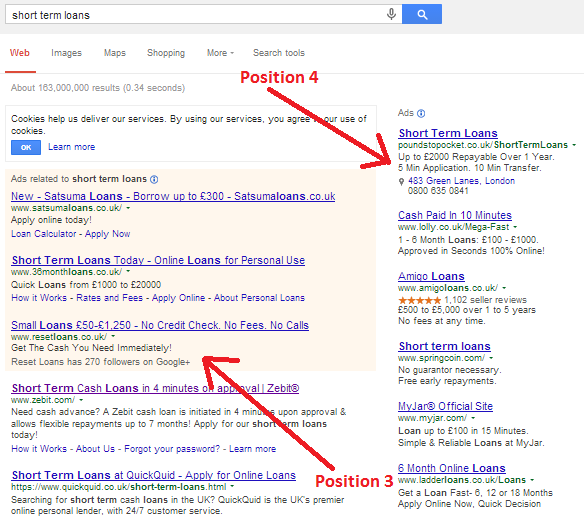
As you can see, at the number one position advertisers can expect click through rates of around 7%, with that number dropping dramatically to 3% for the second position. However, even though it is clear that the number one position is the best place to be, the premium you might have to pay to outbid your competition and get to this position might not be worth the investment. It is possibly wiser to aim for position 2, 3 or 4 as the click through rate is very similar (between two and three percent) across all three of these positions. This means you can get acceptable results for a much lower cost per click than if you were to aim for the top spot. There is even a school of thought that believes that position three and four are the two most cost effective positions, with position three being found only one result above the leading organic result, and position four being at the top of the sponsored results listed on the right side of the page.
In terms of Google’s product listing ads (PLAs), it is widely accepted that click through rates tend to be between 20 and 25 percent higher than normal search advertisement. This means that if you are in a competitive market you should be aiming for a click through rate of around 2.5 to 3 percent, and a click through rate of 6 to 6.5 percent for uncompetitive markets. To improve your PLA click through rates, remember to make your product groupings as small and specific as possible and make sure to include plenty of negative keywords if you find that your ads are being delivered on inappropriate searches. For example, if you sell dog bowls but your product is appearing on searches for “glass fruit bowls”, you might want to include “glass” or “fruit” as negative keywords to avoid irrelevant impressions.
Conversion rate
While click through rates are quite easy to examine and analyse across multiple industries and situations, conversion rates are a whole other beast. Conversion is a behaviour metric, meaning that once your potential customer has landed on your site they will need to behave a certain way to be counted as a successful conversion. What this behaviour is can vary from industry to industry, it could be successfully filling in a form or navigating to a certain page, but in e-commerce it is typically filling a basket and sticking with it until the very end of the checkout process.
As you can imagine, a visitor filling in a form is much more likely to happen than a visitor actually parting with hard earned cash, so a set in stone conversion benchmark is difficult to come by. However, this doesn’t mean that you shouldn’t set yourself a target to aim for.
In terms of benchmarking conversion rates for e-commerce, most industry leaders believe that between 1% and 3% is to be expected. Although just like click through rate, this depends on a few influencing factors.
One of these influencing factors is the price of your product. For very expensive purchases, such as white goods, you might want to set your goal somewhere between 0.5 and 1 percent. However, if your average basket cost is below $100, you might want to aim higher, between 1 and 3 percent. Where you fall in this spectrum depends on how well established your brand is, with highly recognisable or unique brands settling in the upper regions of this estimate.
Conversion rates also vary depending on the device your customer is using. Research carried out by ResponseTap found that an average conversion rate of 1.4% could be expected from an e-commerce site’s desktop users, 1.5% from its tablet users and 0.4% from its mobile users. For this reason it is important to have your site optimised to work on all devices.
Adjusting your click through rate using the methods described in the section above will also have an impact on your conversion rate, as more relevant and engaged clicks generally results in a high number of converting customers even if your overall number of clicks falls. However, unlike click through rate, there are a number of thing you can adjust on your site to improve your number of conversions.
One of the most effective ways to improve your conversion rate on the “site-side” is by creating what e-commerce professionals refer to as a “closed checkout.” A closed checkout is a checkout page which is stylised in a drastically different way to your main site, concentrating on removing distractions and allowing your customer to focus 100% on the task at hand. Removing your product category headers, avoiding links to other parts of your site and keeping the actual form centred on the page are all great ways of ensuring your customers don’t get lost along the way. Other methods to improve conversion rates on your site include creating videos for your products, including genuine customer reviews, using bold add to cart buttons, making it clear that you are available to reach by telephone and including multiple high quality pictures of your products. There are hundreds of things you could do to improve this metric, but the key is experimentation and thorough A/B testing.
The important thing to remember with conversion rates is to not hold yourself to rigid benchmarks and targets. A more effective (and less soul destroying) way of assessing your conversion rate is to see where it stands now, and make a plan to improve it by half a percent. Once this has been achieved and maintained over a period of time you can then move forward with further improvements, perhaps moving your goal forward another half a percent.
Cost Per Conversion
If you only take away one thing from this article, make it this: Constantly monitor your cost per conversion.
Click through and conversion rates are all well and good, but if at the end of the day you are spending more acquiring custom than you are making from it then it is time to seriously rethink your approach. While there are benefits to creating and running a “loss leader” campaign just to bring new custom to your store (in the hope they they will later return on their own accord) for most businesses this simply isn’t a viable strategy.
However, even if you are feeling uncomfortable with your cost per conversion, don’t be tempted to jump ship right away! AdWords and PLAs could still be a viable option for your business and it might only require a small amount of work to bring your cost per conversion right down. Just remember to focus on improving your click through or conversion rates and a lower cost per click will surely follow. Whether you feel that this is happening fast enough for your business is a decision that only you can make.
So, good luck with your future endeavours, may 2014 be the year that your conversion rates soar! If you have any stories or experiences you would like to share, particularly in relation to Google product listing ads, do let us know in the comments below.
blog comments powered by Disqus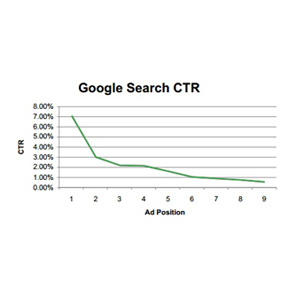
Testimonials


