
Blog
The Antropy OpenCart Blog

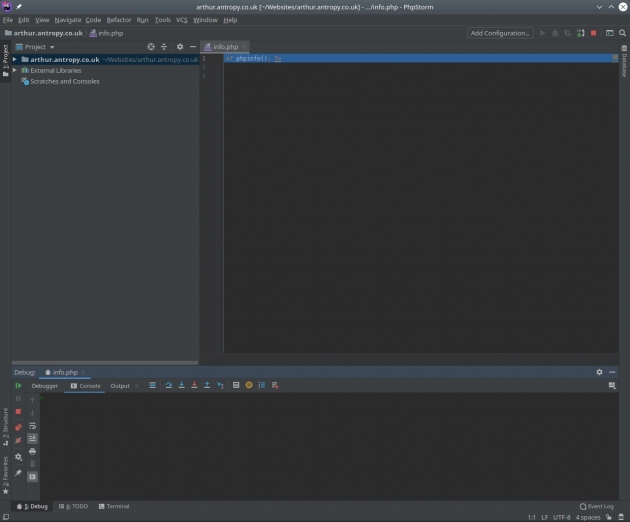
Remotely Debugging PHP with Xdebug
PHP is one of the most popular programming languages in use today and is the language that powers the majority of websites. Although it's free and open source, it is of course very actively developed, with version 7.4 having been recently released and updates being very regularly released.
The popularity of PHP means that it has an amazing array of free and open source software available for it (such as OpenCart or WordPress) and most self-respecting web developers know how to use it which means it's a solid choice for your website - it's not going anywhere any time soon and the community is enormous.
It's surprising then that in all the time I've used PHP (since around 2010) that I haven't come across any PHP developers who use a proper debugger. For the 6 years previously (2004-2010) I worked with Adobe ColdFusion, Flash and Flex, all of which have proper interactive debuggers that allow you to step through the code line-by-line, monitoring variables, adding breakpoints and really seeing what's going on. This obviously makes it relatively easy to find where bugs are occuring which is at least half the battle (probably far more) in solving them.
Luckily, PHP does have a good debugger ...
How to debug PHP remotely with Xdebug (on a cPanel server)
Although a lot of developers prefer to work on a local copy of a website, the nature of our business means this isn't practical - we provide support to OpenCart users which ranges from tiny bug fixes to new site builds. Our minimum charge is currently £50+VAT and the average site we work on is at least 5GB in size and often far more. So if we were going to use local development, by the time we'd started setting up a local copy, we'd have blown the £50 budget. That's why we work remotely on this sort of task over FTP which although not without its flaws is supported by more and more IDEs and is indeed the main method used by the online-only IDE called Codeanywhere.
After a lot of failed attempts to set up Xdebug, Googling, reading old forum posts, installing various packages and IDE plugins, even searching YouTube for setup guides, I realised there wasn't really any guide online that actually showed you step-by-step how to set up Xdebug for remote debugging (i.e. debugging a live website). With this in mind, I managed to get in touch with Derick Rethans, the developer of Xdebug who very kindly talked me through it on the Xdebug IRC channel on the freenode server. And here's how it's done:
There are 3 main parts to getting Xdebug working to start interactively remotely debugging your code:
1. Xdebug must be set up correctly on the web server.
2. Your IDE must be configured correctly to accept incoming connections.
3. The route between your web server and IDE must be open and not blocked by firewalls.
1. Setting up Xdebug
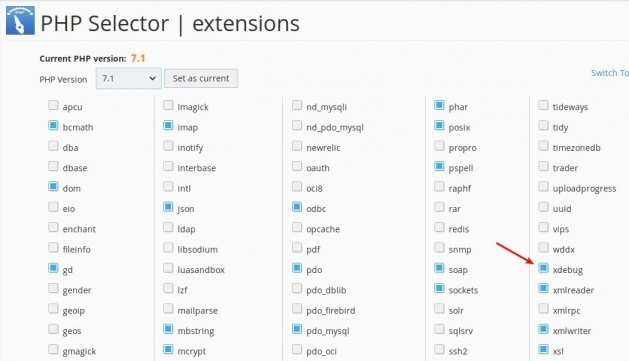
From cPanel, make sure that the xdebug module is selected:
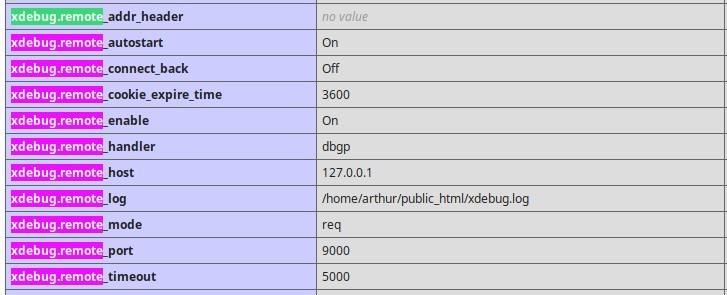
Verify this has actually taken effect with the phpinfo() function in PHP which should show something like this:
The way Xdebug connects to your machine is:
- You start your IDE listening.
- You browse to a PHP file on the server and add something like this to the URL: ?XDEBUG_SESSION_START=foo
- Xdebug reads your IP address from the request and tries to connect to your machine on the port that's configured (default 9000).
- Your IDE should pop up a message asking if you want to accept the connection and then show debug info.
Unfortunately, although I set up port forwarding on my home router to accept connections on port 9000 and forward those to my machine successfully, I wasn't able to configure the server firewall to allow Xdebug to get out through it.
So the method I used to get around this (suggested by Derick) was SSH tunneling. This forwards traffic between localhost port 9000 on my local machine and localhost 9000 on the remote machine so the IDE and Xdebug can talk as if they are on the same machine.
To use Xdebug remotely via an SSH tunnel, the only xdebug settings required are (it will ignore others):
xdebug.remote_connect_back 0
xdebug.remote_host 127.0.0.1
You should verify these have taken effect with phpinfo().
Notes
1. It was handy to set xdebug.remote_log to a path to a log file on the server so that I could see any relevant error messages (yo dawg, I heard you like debugging so I set up debugging on your debugger so you can debug while you debug ... anyway).
2. php.ini settings weren't taking effect due to server security settings, but adding them to .htaccess worked like this: php_value xdebug.remote_connect_back 0
2. Setting up your IDE (PhpStorm)
There's a list of ways to connect to Xdebug remotely on the Xdebug website here. Unfortunately as I tried each in turn I just hit issue after issue. I got as far as compiling the Kdevelop kdev-xdebug plugin from source after making adjustments to the CMake files, following this article by Niko Sams, only for the plugins not to appear in Kdevelop. Eclipse also wouldn't run on my version of Linux (KDE Neon) and a quick attempt to fix this by using a different Java version failed also. I tried several others on the list including the amusingly-named "pugdebug", but again these all failed with various errors/warnings. Having used Linux for many years I'm pretty used to installing any extra packages as needed or finding a quick command to run from askubuntu.com but it seemed that this time whatever I tried ... failed.
TL;DR
It was issue after issue, so I decided that as remote debugging requires 3 parts, I needed a Proof of Concept that worked so I could then try switching to a different IDE once I could be sure Xdebug and the tunnel were working.
So I downloaded PhpStorm and used the free trial. By default, PhpStorm starts listening on port 9000 and this can be verified by running this command on Linux:
lsof -i4 | grep 9000
You should see something like the below as PhpStorm is Java-based:

3. Setting up the SSH tunnel
The IDE was listening and Xdebug was ready to send its lovely debugging info ... but Xdebug was unable to get out past the server firewall - a very common problem with server security increasing daily as hacking becomes a bigger and bigger problem.
Luckily SSH has the ability to create a tunnel and allow port 9000 on my local machine to connect to port 9000 on the remote machine and vice-versa - awesome!
The command to set this up - run on your local machine in a terminal is:
ssh -R 9000:localhost:9000 {remote-user}@{remote-host} {-p remote-port-if-non-standard}
It will ask for the password of that user on the remote machine, and then connect as a normal SSH session, but the tunnel should be set up.
The Moment of Truth
If Xdebug is setup as above and your SSH session is running in a terminal, check PhpStorm is ready to accept the connection by clicking the Run menu item at the top. 3rd from the bottom you should see it says "Stop Listening for PHP Debug Connections" which implies it is currently listening for connections.
Make sure the item below that in the Run menu ("Break at first line in PHP Scripts") is ticked, and browse to a PHP file on the server with Xdebug, passing the URL variable "?XDEBUG_SESSION_START=foo".
A debugger panel appears at the bottom!:
Switching to the "Debugger" tab allows you to see the variables in use:

Amazing, there's a connection from the debugger to PhpStorm and all seems to work - it should be easier to continue getting things set up from here.
One main point to note is that although the "dbgp" protocol that Xdebug and PhpStorm are using here does support the sending of the remote source code, and this is implemented in Xdebug, it's not implemented in PhpStorm or many other IDEs (I'm told it is in the paid IDE, Komodo). This means you'll need a local copy of the PHP code of the website on your local machine and you will need to map the web root to the URL in PhpStorm so it knows that "file.php" on your webserver relates to "file.php" in your project.
Hopefully from here we'll be able to use Xdebug to help us track down some of the more difficult bugs in some of the more complex applications we work with and hopefully this setup guide has helped you too?
If so, or even if not and you're stuck, please comment below! And thanks for reading!